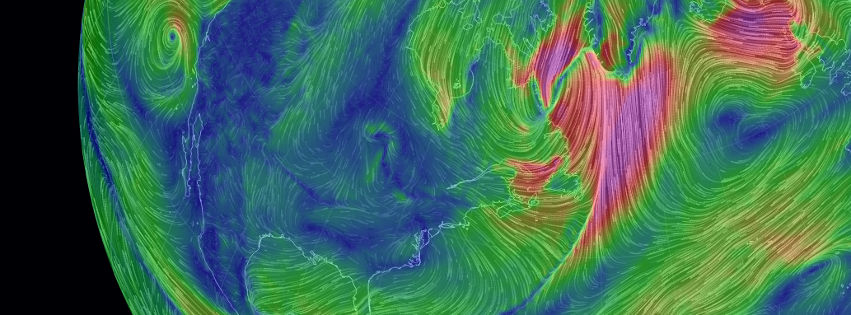
地球
世界中の気象状況がビジュアライズ
スーパーコンピュータが予報
3時間ごとの更新
海流
5日ごとの更新
コミュニティ |
作り手 |
Cameron Beccario @cambecc
ソースコード |
使用ライブラリ |
天気予報データ |
Global Forecast System
NCEP / アメリカ国立気象局 / NOAA
海流データ |
OSCAR
Earth & Space Research
GRIB/NetCDF デコーダ |
地理データ |
ホスティング |
フォント |
ウォーターマン蝶型 |
関連サイト |
インスピレーション |
各気圧によるおおむねの高度
several pressure layers are meteorologically interesting
they show data assuming the earth is completely smooth
note: 1 ヘクトパスカル (hPa) ≡ 1 ミリバール (mb)
1000 hPa |
00,~100 m, near sea level conditions
850 hPa |
0~1,500 m, 大気境界層、低
700 hPa |
0~3,500 m, 大気境界層、高
500 hPa |
0~5,000 m, 渦度
250 hPa |
~10,500 m, ジェット気流
70 hPa |
~17,500 m, 成層圏
10 hPa |
~26,500 m, もっと成層圏
the "Surface" layer represents conditions at ground or water level
this layer follows the contours of mountains, valleys, etc.
overlays show another dimension of data using color
some overlays are valid at a specific height
while others are valid for the entire thickness of the atmosphere
風速 |
wind speed at specified height
気温 |
temperature at specified height
可降水量 (可降水量) |
total amount of water in a column of air
stretching from ground to space
雲水量 (雲水量) |
total amount of water in clouds
in a column of air from ground to space
海面更正 (海面更正気圧) |
air pressure reduced to sea level


weather and ocean data are generated from numerical models
earth.nullschool.net は正確な情報を提供するためのものではありません